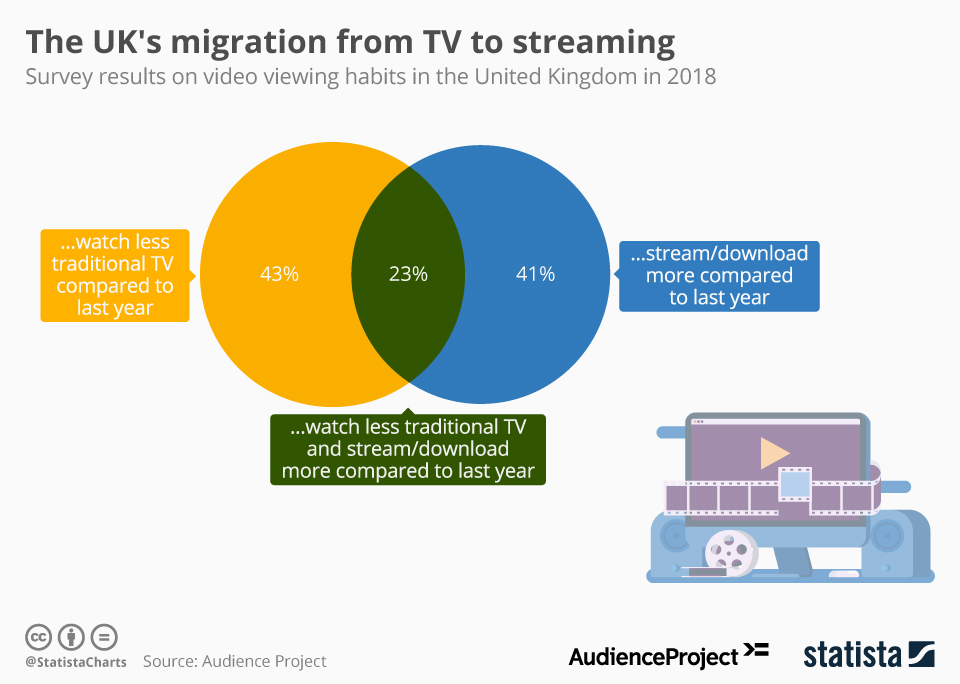
The move away from traditional television viewing is well under way in the UK. As new data from Audience Project shows, in 2018, 43 percent of people watched less TV compared to 2017. At the same time, 41 percent said they were now watching more videos via streams or downloads. As our chart illustrates, meeting in the middle are 23 percent of UK viewers who are making the switch - reducing their traditional TV consumption and increasing their time streaming and downloading. As further data from Audience Project shows, the most popular streaming services in the UK are Netflix, BBC iPlayer and Amazon Prime Video.
Related Infographics
FAQ
- The Statista "Chart of the Day", made available under the Creative Commons License CC BY-ND 3.0, may be used and displayed without charge by all commercial and non-commercial websites. Use is, however, only permitted with proper attribution to Statista. When publishing one of these graphics, please include a backlink to the respective infographic URL. More Information
- The Statista "Chart of the Day" currently focuses on two sectors: "Media and Technology", updated daily and featuring the latest statistics from the media, internet, telecommunications and consumer electronics industries; and "Economy and Society", which current data from the United States and around the world relating to economic and political issues as well as sports and entertainment.
- For individual content and infographics in your Corporate Design, please visit our agency website www.statista.design
Any more questions?
Get in touch with us quickly and easily.
We are happy to help!
Do you still have questions?
Feel free to contact us anytime using our contact form or visit our FAQ page.
Your contact to the Infographics Newsroom


Statista Content & Design
Need infographics, animated videos, presentations, data research or social media charts?