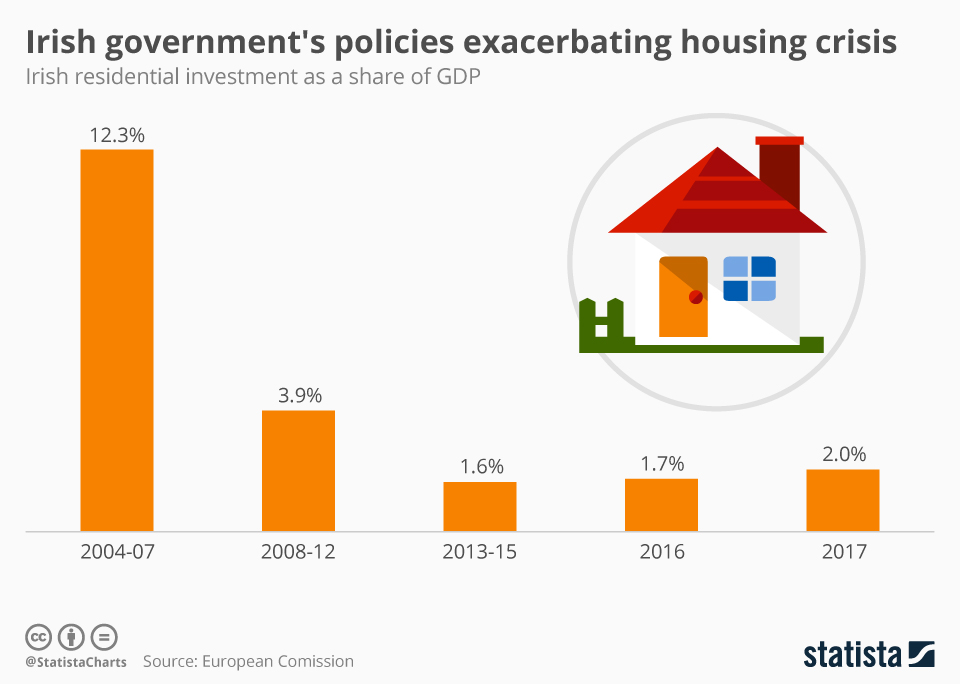
Last week, the European Commission released several country-specific reports detailing the challenges facing EU member states. Considering how badly the Irish homelessness crisis has become in recent years, its country-report contained some grim data about residential investment. While countless families are struggling amid a lack of social housing, Irish residential investment as a share of GDP was 12.3 percent in the period from 2004 to 2007 and that fell to just 2.0 percent by 2017.
Related Infographics
FAQ
- The Statista "Chart of the Day", made available under the Creative Commons License CC BY-ND 3.0, may be used and displayed without charge by all commercial and non-commercial websites. Use is, however, only permitted with proper attribution to Statista. When publishing one of these graphics, please include a backlink to the respective infographic URL. More Information
- The Statista "Chart of the Day" currently focuses on two sectors: "Media and Technology", updated daily and featuring the latest statistics from the media, internet, telecommunications and consumer electronics industries; and "Economy and Society", which current data from the United States and around the world relating to economic and political issues as well as sports and entertainment.
- For individual content and infographics in your Corporate Design, please visit our agency website www.statista.design
Any more questions?
Get in touch with us quickly and easily.
We are happy to help!
Do you still have questions?
Feel free to contact us anytime using our contact form or visit our FAQ page.
Your contact to the Infographics Newsroom


Statista Content & Design
Need infographics, animated videos, presentations, data research or social media charts?