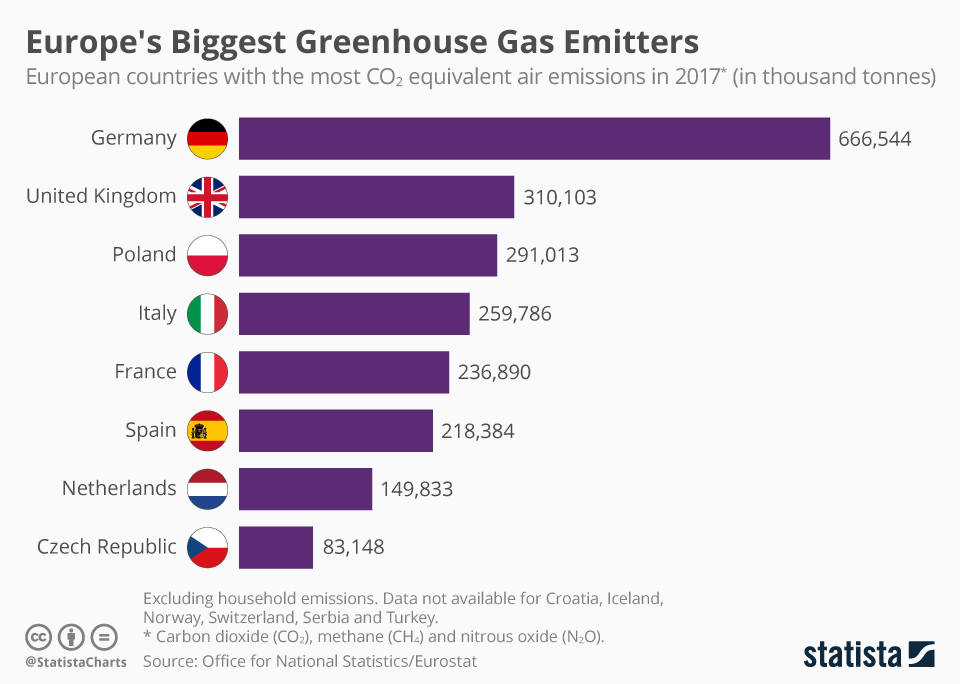
The European Union is the third-biggest emitter of greenhouse gases in the world, and as this ranking from Eurostat and the UK's Office for National Statistics shows, within the EU (and Europe as a whole), Germany is responsible for the largest share of these emissions. In 2017, a total of 667 million tonnes of CO2 equivalent were produced by the Industrial powerhouse. dwarfing the figure of second-placed UK, which was responsible for 310 million tonnes. As detailed on the infographic, these totals do not include household greenhouse gas emissions.
Related Infographics
FAQ
- The Statista "Chart of the Day", made available under the Creative Commons License CC BY-ND 3.0, may be used and displayed without charge by all commercial and non-commercial websites. Use is, however, only permitted with proper attribution to Statista. When publishing one of these graphics, please include a backlink to the respective infographic URL. More Information
- The Statista "Chart of the Day" currently focuses on two sectors: "Media and Technology", updated daily and featuring the latest statistics from the media, internet, telecommunications and consumer electronics industries; and "Economy and Society", which current data from the United States and around the world relating to economic and political issues as well as sports and entertainment.
- For individual content and infographics in your Corporate Design, please visit our agency website www.statista.design
Any more questions?
Get in touch with us quickly and easily.
We are happy to help!
Do you still have questions?
Feel free to contact us anytime using our contact form or visit our FAQ page.
Your contact to the Infographics Newsroom


Statista Content & Design
Need infographics, animated videos, presentations, data research or social media charts?