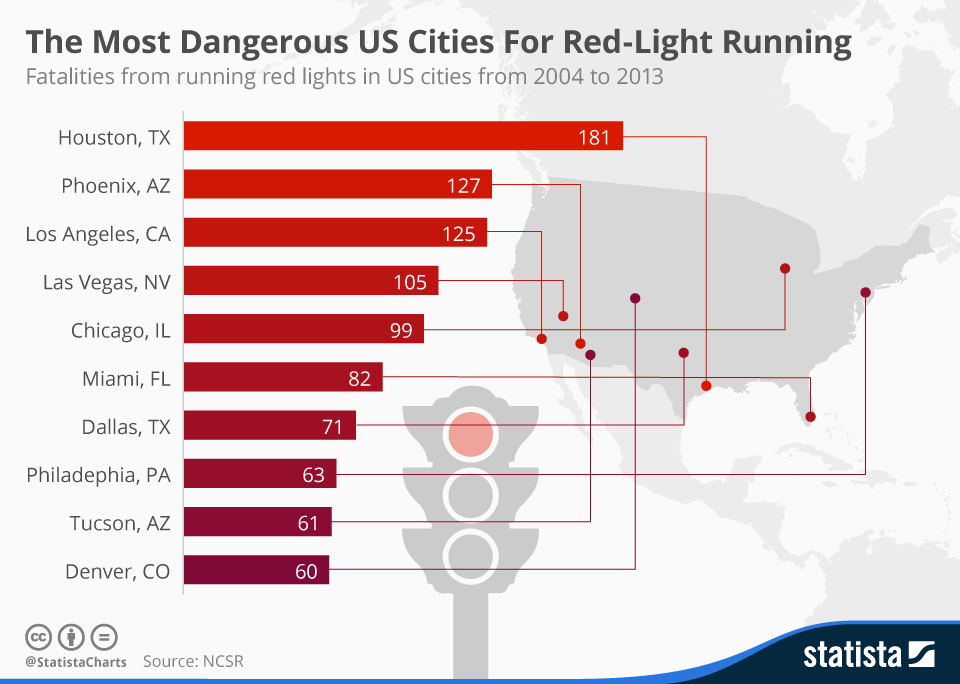
In 2013, at least 697 people were killed in accidents involving red-light running in the United States while an estimated 127,000 people were injured. The majority of incidents usually occur during peak summer driving periods such as Memorial Day, Independence Day and Labor Day. 10,700 people were killed at intersections in the United States between 2004 and 2013 while 3.7 million drivers received a violation for running a red light last year. Houston is the most dangerous city in the United States for running red lights with 181 fatalities from 2004 to 2013, according to the National Coalition for Safer Roads.
FAQ
- The Statista "Chart of the Day", made available under the Creative Commons License CC BY-ND 3.0, may be used and displayed without charge by all commercial and non-commercial websites. Use is, however, only permitted with proper attribution to Statista. When publishing one of these graphics, please include a backlink to the respective infographic URL. More Information
- The Statista "Chart of the Day" currently focuses on two sectors: "Media and Technology", updated daily and featuring the latest statistics from the media, internet, telecommunications and consumer electronics industries; and "Economy and Society", which current data from the United States and around the world relating to economic and political issues as well as sports and entertainment.
- For individual content and infographics in your Corporate Design, please visit our agency website www.statista.design
Any more questions?
Get in touch with us quickly and easily.
We are happy to help!
Do you still have questions?
Feel free to contact us anytime using our contact form or visit our FAQ page.
Your contact to the Infographics Newsroom


Statista Content & Design
Need infographics, animated videos, presentations, data research or social media charts?